This is the third article in a series on novel ideas for SaaS metrics, which started with The unprofitable SaaS business model trap and COC: a new metric for cancellations.
You can’t read an article about SaaS metrics without running into LTV — The Lifetime Value of a customer. Meaning, the gross revenue you expect to get from a customer over its entire lifetime.
The traditional formula is as follows, where MRR is monthly recurring revenue, GPM is gross profit margin (i.e. percent of MRR left over after paying for the cost of servicing the customer, such as servers, bandwidth, and tech support), and N is “expected months,” i.e. how many months you expect this customer to stick around:
[latex s=2]LTV = MRR * GPM * N[/latex]
The trick is computing N; the other numbers are straightforward. The traditional way is N = 1/c where c is your monthly cancellation rate, so if 2% of your customer bases cancels each month, N = 50.
I believe this calculation for N is too generous, and it’s a cause of SaaS companies having trouble with profitability.
The derivation of the N = 1/c formula seems logical. Consider a cohort of customers signing up in January. You earn R revenue from them in January. Then in February, c of them cancel, so you each R(1-c) in February. Then another c of those cancel, so in March you earn R(1-c)(1-c). If you continue this process ad infinitum, and add it all up, you get R * 1/c, therefore 1/c is the “average” number of months any one customer sticks around.
Said another way, the actual distribution of revenue over infinite months would add up to the same thing as if all customers stayed 1/c months, and then all cancelled.
Therefore, from an LTV perspective, where all we care about is “total revenue over the lifetime of the customer, no matter how long or short that lifetime is,” 1/c seems like a good value for N.
In fact, I’ve made the same argument before.
The fallacy in the argument is the “ad infinitum” part. Even if it’s true that some customers do stick around for very long periods, say 10 years, it’s incorrect to use that for the purpose of an LTV calculation.
It’s impossible to see ahead to timeframes beyond a few years for a young company and perhaps 4-6 years for a mature one. In those timescales you expect drastic changes in market conditions — a strong new competitor appears or dies, the economy slumps or soars, a disruptive technology changes the landscape, etc..
That in turn will cause material changes in pricing, retention rates, reorganized customer segmentation, usage levels, service levels, and so forth.
Computing expected months with the ad infinitum approach leads you to over-estimate the total revenue you can depend on. So when you make decisions like “A LTV:CAC ratio of 3:1 is healthy,” you’re understating dependable LTV and thus incorrectly thinking you’re acquiring customers at a reasonable cost. Which then leads to unprofitable growth.
So, how to fix the formula for N?
The Fix #1: Month Cap
The idea of the “month cap” is to say “Let’s only count the next 4 years of revenue.” (This is how I currently do it at WP Engine.)
Thus, in the explanation above, you add up 48 months’ worth of revenue rather than adding up infinite months. The formula, assuming a cap of m months, is:
[latex s=2]N = \frac{1-(1-c)^m}{c}[/latex]
How different is this formula compared to the usual one? Here’s a sample for different values of c, for m = 48:
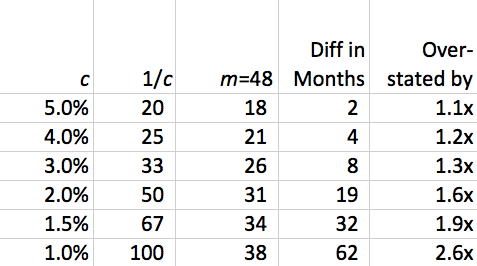
In short, it’s not a huge difference for large cancellation rates (but who cares because with 5%/mo cancellation you’re in deep financial trouble anyway!), but it’s quite material for healthy cancellation rates — in fact it can be overstated by 2x!
The Fix #2: Discount Rate
A different approach to fix the formula is to use something that financial analysts call a “discount rate.”
Here’s the idea. In today’s dollars, what are future dollars worth? Inflation, for example, would make future dollars worth less in today’s dollars, and the further out in the future you look, the more we’d “discount” (or “reduce”) those dollars in terms of today’s dollars.
More to the point at hand, simple uncertainty in collecting future dollars make them worth less in today’s dollars.
So it’s OK to add up revenue five or even ten years from now, but you have discount its value.
Generally you compute the discount exactly the same way as cancellation is done above — you deduct, say, 1%/mo extra for each month in the future to account for this uncertainty. This is equivalent to (approximately) 12%/yr, so e.g. in the 8th year we’re still adding up revenue but discounting it downward by 64%, accounting for the uncertainty that we’d still be operating in the same way in 8 years that we are today.
The formula for including a discount rate is very simple — for a monthly discount rate of d, (e.g. in the example above, d=0.01), you just add it to c and use the same formula, because mathematically a discount rate is exactly the same calculation as a cancellation rate! So:
[latex s=2]N = \frac{1}{c+d}[/latex]
How different is this formula compared to the usual one? Here’s a sample for different values of c, for d = 0.01:
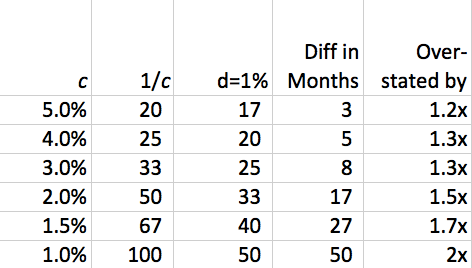
As with the Month-Cap technique, this is a material difference for healthy cancellation rates. Personally I think even d=0.01 is too generous unless it’s a mature, predictable business.
Which method?
Although we’ve been using the Month-Cap method at WP Engine, now that we’re three years into the business we have a much better understanding of multi-year retention rates. Capping at 48 months definitely doesn’t make sense for our older customers, so although I still like the concept of a monthly cap, the discount rate method seems like a better fit to our data.
What do you think? Does this match up with your data and expectations? Let’s continue talking about it in the comments.